
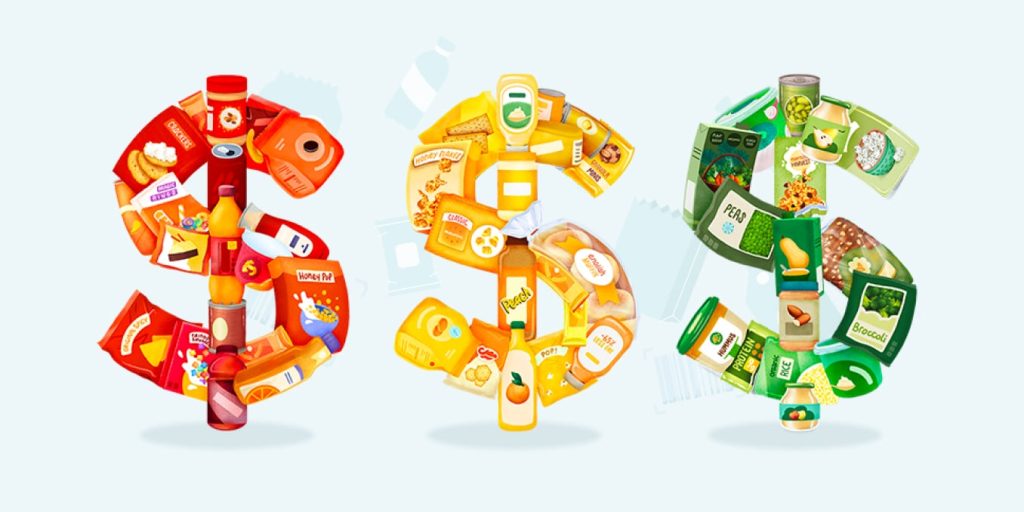
Price vs Quality: The Hidden Costs of Low-Priced Food
In a report, Yuka and Harvard Law School’s Food Law and Policy Clinic reveal a striking reality about how price shapes food composition in the United States, to the detriment of consumers. Drawing on an analysis of more than 800 food products sold nationwide across 12 of the most common processed food categories, including cereals, bread, and other everyday staples, the study examines how additives, sugar, and sodium vary across price ranges.
The findings are clear: lower-priced products contain significantly more additives, sugar, and salt, exposing a two-tier food system where access to healthier products is largely reserved for those who can afford them. This report combines robust data with policy recommendations to show how food policies shape what ends up on Americans’ plates and what must change to make healthy food the standard, not a privilege.
A joint study by Yuka and Harvard Law School’s Food Law and Policy Clinic.
Cheaper Products Contain More Additives
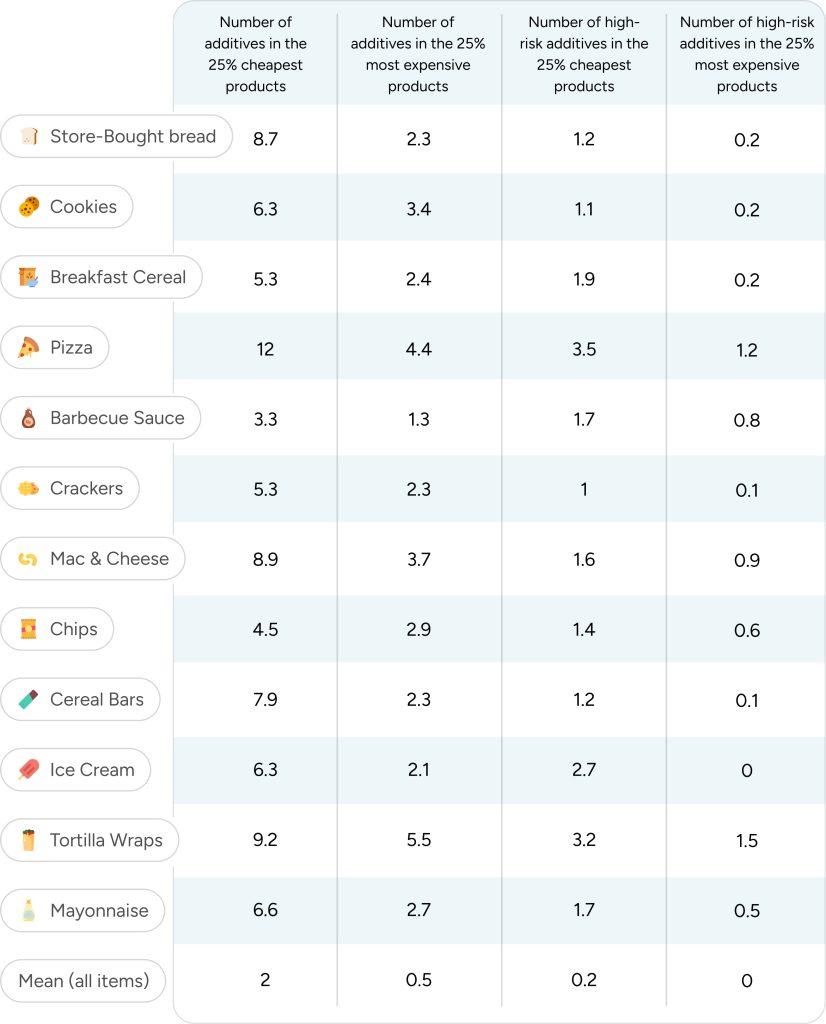
Across the 12 categories analyzed, the cheapest products contain, on average, 2.6 times more additives than the most expensive ones. Products in the lowest price quartile (25%) contain an average of 6.6 additives per item, whereas those in the highest price quartile (25%) contain an average of 2.7 additives.
The gap is even larger for the most concerning additives, assessed as high-risk on Yuka. The lowest-priced products contain, on average, over 3 times more high-risk additives than the highest-priced ones.
Overall, the results point to the same conclusion: avoiding additives—and especially high-risk additives— isn’t equally affordable. Products without high-risk additives are, on average, 63% more expensive than those with high-risk additives.
Store-bought bread
Store-bought bread is a staple in the U.S., appearing in everyday meals—from breakfast toast and children’s sandwiches to burger buns and quick dinner sides. Supermarkets devote entire aisles to it, offering a wide range of options—white, whole wheat, multigrain, sourdough, brioche, seeded, or “healthy” varieties—making it a typical product where prices vary widely while choice appears abundant.
For this category, we analyzed 61 store-bought bread products from 43 different brands, selected among the most scanned on Yuka. The results show a clear and significant association between price and the number of additives: the cheapest products contain nearly 4 times more additives than the most expensive. Products in the lowest-priced quartile contain an average of 8.7 additives, whereas those in the highest-priced quartile contain an average of 2.3 additives.
When focusing specifically on high-risk additives, the contrast is even more striking: in the lowest-priced quartile, 75% of breads contain at least one high-risk additive, compared with only 12% in the highest-priced quartile. And this gap shows up directly in what consumers pay: store-bought breads without high-risk additives are, on average, 28% more expensive than those with high-risk additives.
Breakfast cereal
Breakfast cereals have recently become the subject of significant U.S.-specific scrutiny, as major brands face criticism for using artificial colors and other additives in products heavily marketed to children, despite cleaner formulations existing abroad. This context makes cereals an illustrative category for examining how price influences families’ purchasing decisions.
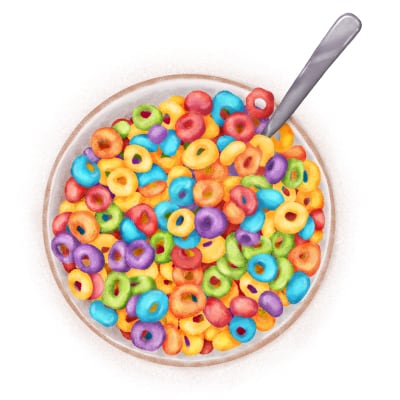
We analyzed 83 breakfast cereals from 61 different brands, and the quality gap is evident. The cheapest cereals contain about 2 times more additives than the most expensive quartile, with an average of 5.3 additives per product. The contrast is even stronger for high-risk additives: in the lowest-priced quartile, 61% of breakfast cereals contain at least one high-risk additive, compared with 19% in the highest-priced quartile.
In other words, avoiding high-risk additives costs more: breakfast cereals without high-risk additives are, on average, 65% more expensive than those with high-risk additives.
Pizza
Pizza is deeply embedded in U.S. food culture: one of the most widely eaten comfort foods, shared at family nights, birthday parties, school events, and major sporting events. It has become a default meal choice—one broadly accepted across households—and is consumed regularly, making it a meaningful part of weekly diets.
In this category, our analysis of 70 pizzas shows the same price–quality trend observed in other food staples. The additive load in low-priced pizzas is extremely high: the cheapest products contain 12 additives per product on average (including 3.5 rated high-risk on Yuka), versus only 4.4 additives per product among the most expensive pizzas (including 1.2 rated high-risk). Pizzas without high-risk additives are, on average, 35% more expensive than those with high-risk additives.
Wraps
Wraps capture two core American habits at once: eating on-the-go and the desire to “make it healthier.” They are often marketed as a better-for-you alternative to bread—but that health halo can conceal highly processed formulations designed for softness, flexibility, and long shelf life.
For this category, we analyzed 53 store-bought wraps from 31 different brands. The association between price and the presence of additives is clear: the cheapest wraps contain, on average, 69% more additives than the most expensive ones. The gap is even more pronounced for high-risk additives: the lowest-priced quartile contains more than twice as many high-risk additives as the highest-priced quartile (3.2 versus 1.5 high-risk additives per product).
Recap
Cheaper Products Contain More Sugar
The price–composition gap doesn’t end with additives. Sugar follows the same pattern: lower-priced products are both more additive-heavy and significantly sweeter. This is especially concerning in the U.S., where on average, Americans consume up to three times the sugar intake recommended by the WHO¹. Added sugars are consistently linked to major chronic conditions, including obesity, type 2 diabetes, hypertension and cardiovascular disease mortality.²
Across the 12 categories studied, the cheapest products contain, on average, 21% more sugar than the most expensive. Conversely, the least sugary products cost, on average, 23% more than the most sugary.
Breakfast cereal
Breakfast cereals have become a focal point in the U.S. debate on additives, particularly due to the widespread marketing of best-selling products to children; however, sugar constitutes an equally structural concern in this category. In fact, the price gap mirrors what is observed for additives: cereals in the lowest-priced quartile contain, on average, 73% more sugar than those in the highest-priced quartile—26g of sugar per 100g of product, compared with 15g in the most expensive ones.
For families seeking less sweet options, the trade-off is clear: cereals in the lowest-sugar quartile are, on average, twice as expensive as those in the highest-sugar quartile.
Ice cream
Ice cream is a U.S. supermarket institution that became mass-market with the advent of industrial refrigeration, and Americans continue to consume it at exceptionally high levels—about five gallons per person per year.³ The category has also shaped global ice-cream culture through iconic U.S. brands such as Häagen-Dazs and Ben & Jerry’s.
Here too, based on our analysis of 47 products from 28 different brands, price tracks sugar content: ice creams in the lowest-priced quartile contain, on average, 31% more sugar than those in the highest-priced quartile—21g of sugar per 100g, compared with 16g of sugar. Products in the lowest-sugar quartile are, on average, 47% more expensive than those in the highest-sugar quartile.
Keep reading at https://yuka.io/en/report-yuka-harvard-price-vs-quality-food-products/
Comments
0 comments
Please sign in to leave a comment.